Are we really on the cusp of a renewables revolution? A deep-dive into some ground realities summarising the potential de-carbonisation of global energy supply
The BNPL player of the rooftop solar industry - Brighte - recently raised a $100m from investors comprising Grok Ventures, Skip Capital and AirTree Ventures.
Founded in 2015 by Katherine McConnell, the company has approved over $500 million in finance for 60,000 households and has accredited more than 1,700 solar installers, and its customers have generated more than 500GWh of clean energy.
The company is going after a large total addressable market estimated at $45Bn.
Big numbers!
Clearly, the rooftop solar industry in Australia is enjoying its moment in the sun :)
More interestingly it follows a global trend in renewables, one that promises to replace fossil fuels and usher in an age of de-carbonisation.
Before we unravel the timeline for a potential transition to renewable energy, we should try and analyse the primary driver of the optimism around renewables adoption - the steep decline in the cost of solar and wind energy.
So how did renewables become so cheap so fast?
Our World in Data - a website managed by researchers at the University of Oxford - summarises their outlook as below
Low-carbon technologies that were so expensive just a few decades ago that they were only affordable for satellites have came down steadily in price and now provide the cheapest electricity on the planet (which implies that they are now the cheapest source of energy that humanity ever had access to)
They rightly point out that if we are to transition to renewable energy - the relative costs of renewables needs to be competitive with fossil fuels. The costs are compared using the ‘Levelised Costs of Energy’ (LCOE), a concept which captures the cost of building the power plant itself as well as incorporating the ongoing costs for fuel and operating the power plant over its lifetime.
Over the last decade (2010 - 2020), the LCOE of solar (PV) and wind has dropped by 89% and 70% respectively. Moreover, the LCOE of solar and wind seems to have dropped to less than half of coal.
So what is driving the decline in costs?
The short answer, according to the Oxford researchers, is the experience curve or learning curve - which represents the relationship between how proficient someone is at a task and the amount of experience they have. Proficiency usually increases with increased experience, that is to say, the more someone performs a task, the better they get at it.
As per the Oxford researchers with each doubling of installed capacity (more experience) the cost of solar modules dropped by ~20% (greater proficiency).
Ultimately - the lower LCOE results in cheaper electricity costs from renewables (in theory at least)
Not only are they cheap but also safe and clean…
As you may have guessed - Wind and solar are way safer and cleaner than fossil fuels.
…Making renewables irresistible
So what is the overall message from the website
Renewable energy technology follows the learning curve i.e. the costs keep dropping as we get more and more experience (of building them)
Renewable energy is the safest and cleanest source energy
Thus to achieve a low-carbon, low-cost future we must keep building our renewable energy generation capacity.
In other words, by lowering the cost we are making it irresistible to the consumers. Plus they get to save the world.
But what does save the world really mean?
The Intergovernmental Panel on Climate Change (IPCC) is an intergovernmental body of the United Nations that is dedicated to providing the world with objective, scientific information relevant to understanding the scientific basis of the risk of human-induced climate change, its natural, political, and economic impacts and risks, and possible response options. (blame Wikipedia for that long-winded intro)
As per an IPCC special report on global warming published in October 2018, the IPCC has specified a temperature target of 1.5°C. This requires emissions to start falling immediately at a rapid rate to be reduced to zero (or become negative with sequestration) by 2050
All this seems super optimistic and aggressive. Perhaps, it’s been done on a smaller scale before….
Could Germany’s model be the potential way forward to achieve our climate goals?
Here is technologist Ramez Naam
We can take a lesson from the most effective climate policy of all time – Germany’s early subsidies of solar and wind.
Solar panels and electricity-producing wind farms have been around for decades. Yet, for most of that time, they’ve been a far more expensive way to produce electricity than burning coal or natural gas. Germany changed that.
Starting in 2010, Germany’s Energiewende legislation heavily subsidized solar and wind. That, in turn, drove utilities and home owners and corporations to purchase solar and wind. And that, in turn, made the technology cheaper. As prices fell, other nations – first European nations, then the US, and then China – jumped into the fray, enacting more ambitious policies that further brought down the price of solar and wind (and now batteries and electric cars).
Germany has almost doubled its installed energy generation capacity by growing its renewable energy capacity from 41GW in 2000 to 114GW in 2017 - a 2.7x increase.
Below chart from a BCG report highlights the increased global adoption of renewables (indexed to 1970 levels)
Thus, it may seem that we have found a way to tackle climate change.
And I was feeling incredibly gung ho before I came across the writings of a certain Canadian of European descent - Vaclav Smil.
Professor Vaclav Smil is a Distinguished Professor Emeritus in the Faculty of Environment at the University of Manitoba and a Fellow of the Royal Society of Canada.
He is known as a “slayer of bullshit”. But his most relatable claim to fame is a famous follower.
Well, as I had mentioned previously, the Germans were among the first to embrace the renewables trend wholeheartedly. Between the year 2000 and 2017 - they grew their installed capacity of renewables energy generation by 2.7x. As a result, renewables comprised almost 60% of its electricity generation capacity.
Early movers - surely they must be reaping the rewards of a cleaner environment and cheaper consumer electricity prices. Right?
Here’s some analysis from Professor Smil.
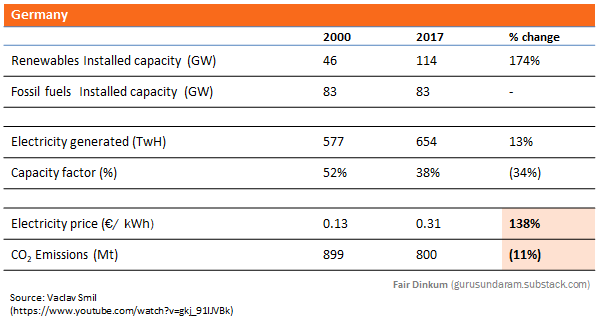
Germany grew its installed renewables capacity at an estimated cost of c.$500bn to hasten the transition from fossil fuels.
Outcome
Residential electricity price:
The exercise ended up having a perverse result of more than doubling electricity price to the residential consumer. This might be partially driven by the lower efficiency level of renewables evidenced by the sharp drop in the capacity factor. Germany is only using 38% of its installed electricity generation capacity due to the intermittency associated with solar and wind capacities. The effectiveness of solar plants is hampered by the fact that Germany sees the sun only 10% of the time given its position in the Northern Hemisphere. Solar can work great but is best where the sun shines a great deal.
Emissions:
The Carbon-dioxide emission level dropped by only 11% as a result of this transition. To get some perspective, during the same period, USA’s emissions dropped by 12%. Surprisingly, the US achieved that by moving from one polluting fossil fuel (coal) to a slightly less polluting fossil fuel (natural gas).
The final point to note is that in 2000, before installing the massive renewable energy capacity about 85% of Germany’s total energy needs were serviced by fossil fuels. About two decades and $500Bn later this number had only dropped to 80%.
To get a better sense of why this is the case - we need to understand who are the end-users of energy.
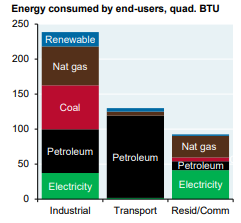
Global energy consumption - Industrial and Transport sectors are the largest consumers
The below chart gives an overview of global energy consumption split by end-user i.e. Industrial, Transport and Residential / Commercial. It also shows the sources of energy.
Source: JP Morgan Tenth Annual Energy Paper, 2020
Ignoring the quaint measuring units (BTU or British Thermal Units) - the vital thing to note is that the quantum of energy consumed by the Industrial sector is 2.0x Transport and 2.5x Residential / Commercial sector.
Globally, the Industrial sector is the largest user of energy and is heavily reliant on direct fossil fuel use; Transportation is almost 100% reliant on petroleum products.
The green bar which refers to the use of electricity as energy source accounts for only 17% of global energy consumed by end-users. Only 17%!
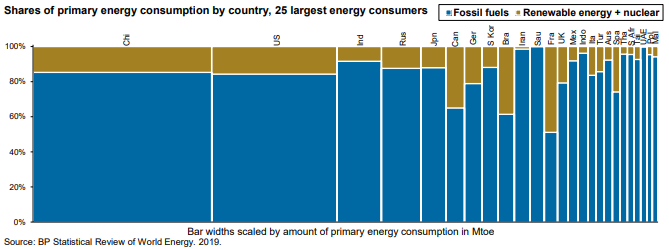
Most of the renewable energy focus has been on replacing fossil fuels in use of electricity generation. As a result, around 30% of electricity is generated using renewable sources. Only 11% is wind and solar though, rest is from hydro-power.
But there are limits of just de-carbonizing the electricity grid.
Our world uses fossil fuels for c.85% of its energy needs. (Check out Germany!)
You would think that’s because it takes time for the installed capacity of renewables to catch-up with fossil fuels.
But in reality - it’s much harder to replace fossil fuels in Industrial and Transport use as compared to electricity generation.
The four pillars of modern civilization: ammonia, cement, steel and plastics depends on large-scale inputs of fossil fuels, both for process heat and as feedstocks
Currently, the industrial sector - the largest global end-user of energy, uses fossil fuels as raw material inputs, and to supply high-temperature heat and pressure. Decarbonisation of the industrial sector would require the substitution of direct thermal heat and pressure derived from fossil fuels by electricity.
As seen in the chart below - Steel, plastics, ammonia (for fertilisers) and cement - all of these use carbon-based fuels in their manufacturing process
The IEA expects consumption of all 4 to rise by 2050 (cement by 12%, steel by 30%, ammonia by 60% and plastics by 150%)
The manufacturing process of all these components relies heavily on heat generated from fossil fuels.
So why isn’t electricity used for their manufacture?
Here is the ground reality from Prof Smil, outlining the key challenge faced by the Industrial sector
All of these processes have one important characteristic in common: there is no availablenoncarbon alternatives that could be readily deployed on mass commercial scales
There are some interesting innovations, and entirely new pathways might be possible -- ranging from new catalyses for ammonia synthesis (Ashida et al. 2019) to hydrogen-based steelmaking (Green 2018) -– but none of these innovations has been deployed even as pilot plant experiments and, once again, it is obvious that scaling up those processes that may eventually prove acceptable in order to reach annual outputs of hundreds of millions, even billions, of tonnes is a task that would take generations to accomplish.
Moving on to Transport.
Energy density - one of the reasons why it’s difficult to replace fossil fuels in Transport
People generally will intuitively understand ‘Energy density’ of an energy source i.e. the amount of energy per unit of weight (tonne) or unit of volume (cubic metres).
All things equal, you would want to use an energy source with a higher energy density.
Another analogy, if you want to pack the minimum volume of food for a mountain hike you take a granola bar (17 J/g) not carrots (1.7 J/g).
Here is the challenge facing the Transport industry
Given the energy density of today’s best commercial batteries, the electrification of trucking, shipping and flying is even more challenging.
The key to understanding the fundamental difficulty is to compare the energy density of the best Li-ion batteries with the energy density of diesel fuels used in trucking and shipping.
Today Li-ion batteries have energy density of up to 260 watt-hour per kilogram (wh/kg) and could reach up to 500 wh/kg in the future. The energy density of diesel and aviation kerosene is 12,600 wh/kg and 12,800 wh/kg.
In other words, 50 times the energy density of our best commercial batteries. So shipping and flying present particularly insurmountable challenges as only high energy density fuels can power massive container ships and high-capacity airliners.
(Yes, even the most advanced Tesla batteries have an energy density of about 260 wh/kg)
Another useful concept to comprehend is Power density.
Power density - A useful measure to compare the efficiency of fossil fuels against renewables
As mentioned before ‘energy density’ of an energy source i.e. the amount of energy per unit of weight (tonne) or unit of volume (cubic metres).
However, energy densities are not very useful when comparing with renewable sources like wind and sunlight. Very difficult to calculate energy per kg or cubic metre of wind or sunlight :)
For that, we need to understand the concept of Power density.
‘Power density’ comes in handy as it measures energy flux per unit of horizontal surface area. Energy flux is the rate of transfer ofenergy through a surface. It’s measured in watts per square metre.
In other words, it measures how much energy is produced per unit of horizontal surface area, either land or water for a particular method of energy generation.
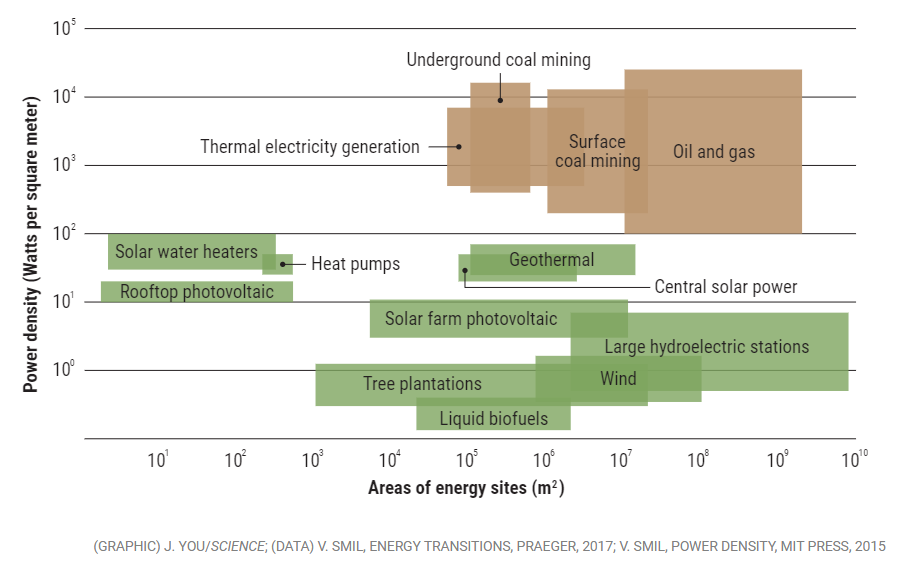
The below chart showcases the power density of various fossil fuels and renewable sources of energy. The y-axis measures power density and the x-axis measures the area of the energy site.
Power Density
What can be seen pretty clearly is that the power density of fossil fuels are an order of magnitude greater than renewables. In other words, for e.g. on a similar-sized area of land, a coal plant might be 2 to 3 orders of magnitude more efficient in generating energy than a solar PV farm.
This is important because, in our history, humans gave only moved up the power density curve so far. Moving from wood to coal, coal to oil and now towards natural gas.
When we imagine a decarbonised world - we fail to imagine the enormity of the challenge. From the power density perspective - it’s like turning the clock back.
Consider a thought experiment: Conversion of significant fossil fuel driven energy production infrastructure to renewable sources.
Can you imagine the amount of land/water surface area that will be needed to service all our energy requirements given the lower power densities of renewable sources?
It would be 2 to 3 orders of magnitude more area than what is required by existing fossil fuel plants.
Here is a summary from Professor Smil
These new energy infrastructures would have to be spread over areas ten to a thousand times larger than today’s infrastructure of fossil fuel extraction, combustion and electricity generation: this is not an impossible feat, but one posing many regulatory (environmental assessments of affected areas, rights-of-way permission and inevitable lawsuits), technical and logistic challenges
As the quantum of land or water area is a major obstacle, you may consider implementing distributed energy systems.
Would distributed energy systems work?
Many people believe that distributed energy systems like rooftop solar and battery systems might be the way forward.
The key determinant is comparing the power densities of distributed electricity generation with that of prevailing urban electricity demand yields.
To remind ourselves - the power density of roof-based solar panels is generally c. 20 W/sq m)
A citywide mapping of New York revealed the following power densities on the demand side
Downtown areas: 900 W/sq m
Midtown South: 400 - 500 W/sq m
Residential boroughs: 25 W/sq m
Warehouses: 15 - 30 W/sq m
Schools: 50 - 75 W/sq m
Offices and Commercial spaces: 40 - 90 W/sq m
Since 2007, more than half of the global population has been living in cities, and that share is projected to rise to 70% by 2050. The recent rapid growth of megacities (cities with a population greater than 10 million) has perhaps been the most remarkable part of this trend.
Most megacities have extraordinarily high population densities, with averages greater than 10,000 people/sq km and the greatest numbers in city centers where populations surpass 40,000 people/sq km.
Below example showcases the massive shortfall of a potential distributed energy system in Tokyo
For example, Tokyo’s most densely populated area (its 23 special wards) covers 619 sq km, houses 9.2 million people, has average irradiance of 151 W/sq m , and has a total of about 64 sq km of roofs suitable for PV installation.
PV panels that would produce 20 W/sq m and cover all of those roofs would generate nearly 31 GWh/day while the area’s current average demand is about 150 GWh/day. Even such an extreme action as covering every roof in Tokyo with PV panels would supply only 20% of the average electricity needed
Thus it seems that in regions of the world where population density is low and houses are large with suitably large roof-areas (for e.g. suburban areas of Australia) - distributed systems might work pretty well. But in large parts of the world (China and India) where the population density is high, distributed systems might not really work.
Few other problems to consider for renewable pathways
Materials shortage:
Renewable energy is unlimited.
However, renewable energy systems depend on natural resources that exist on planet Earth in fixed amounts and are very much non-renewable.
One good example is lithium, which is used in the manufacture of batteries, which are crucial for bulk adoption of renewable energy. We know that there is a finite amount lithium available to us and we are counting on future re-cycling technology breakthroughs to solve this problem.
Another sticky issue might be the dependence on rare-earth elements, which unlike as the name suggests are not as rare. But 95% of the supply is controlled by one country - China.
Storage
We talked about the potential massive capacity build-out in wind and solar power plants to cater to global energy needs.
This view generally assumes that storage technology i.e batteries also keep pace.
However, long-term utility-scale energy storage via electrochemical batteries is an industry that is still in its infancy. Less than 1% of US electricity generation was stored in 2019, and almost all of this storage occurred in decades-old pumped hydro facilities rather than in batteries.
Windmills - an embodiment of fossil fuels and other rare-earth elements:
Well, let me just say windmills have an excellent PR team.
Whenever we cast our eyes on a windmill we are probably filled with a feeling of happiness - looking at a magnificent tall structure quietly generating clean energy.
But consider the elements of a windmill - steel for the towers, plastic derivatives for the blades, cement for the foundation and rare earth elements used in the turbines.
You can always rely on Professor Smil to give you some perspective
Large trucks bring steel and other raw materials to the site, earth-moving equipment beats a path to otherwise inaccessible high ground, large cranes erect the structures, and all these machines burn diesel fuel. So do the freight trains and cargo ships that convey the materials needed for the production of cement, steel, and plastics. For a 5-megawatt turbine, the steel alone averages 150 metric tons for the reinforced concrete foundations, 250 metric tons for the rotor hubs and nacelles (which house the gearbox and generator), and 500 metric tons for the towers
Undoubtedly, a well-sited and well-built wind turbine would generate as much energy as it embodies in less than a year. However, all of it will be in the form of intermittent electricity—while its production, installation, and maintenance remain critically dependent on specific fossil energies
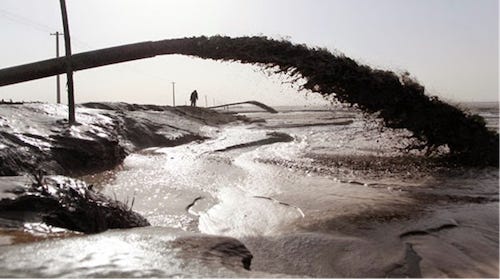
To make matters worse, wind turbines use Neodymium, a rare earth metal which is used to make the powerful magnets.
Neodymium is sourced from Baotou in China, under conditions which do not inspire the same feeling that we get while looking at a windmill.
The lake of toxic waste at Baotou, China, which as been dumped by the rare earth processing plants in the background
Inside the Baotou Xijun Rare Earth refinery in Baotou, where neodymium, essential in new wind turbine magnets, is processed
Caesar Augustus reigned over the Roman Empire from 27BC to AD14.
Apparently, Augustus deplored rashness in a military commander and one of his favourite sayings was Festina Lente.
Loosely translated it means - ‘make haste, slowly’. One can also take it to understand that activities should be performed with a proper balance of urgency and diligence. If tasks are rushed too quickly then mistakes are made and good long-term results are not achieved. Just ask our German friends!
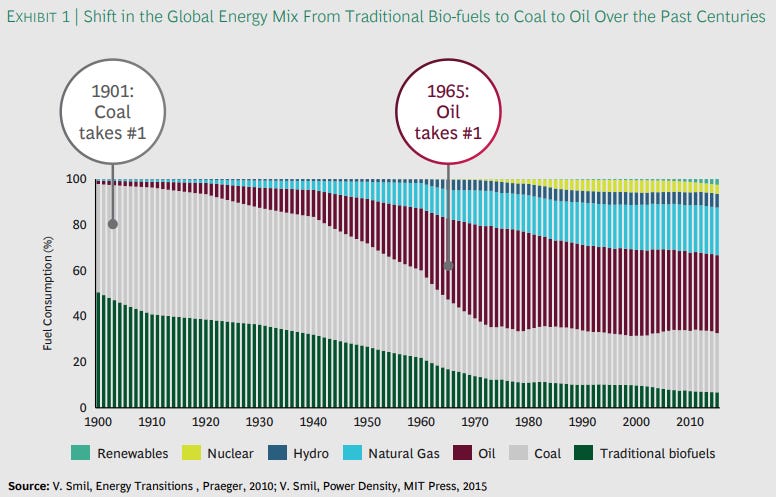
The broader point is that energy transitions take a lot of time. Below chart depicts the growth in the share of coal, crude oil and natural gas over the initial 50 year period.
While all the development and excitement around renewables should be embraced with both arms, we also need to be aware of the ground realities.
The verdict — based on the history of past energy transitions, on the unprecedented scales of the unfolding shift, on the limits of alternative pathways, and on the enormous and immediate energy needs of billions of people in low-income countries –- is clear
The complete decarbonization of the global energy supply will be an extremely challenging undertaking of an unprecedented scale and complexity that will not be accomplished –- even in the case of sustained, dedicated and extraordinarily costly commitment – in a matter of few decades
Looks like we are in for a good-ol’ high-quality test match rather than a Twenty20.
On the bright side - it’s been less than 2 months since my last post. Relatively speaking - that’s commendable transition time!
Happy New Year! Looking forward to a cracking year.
This is a fantastic article. Insightful and engaging. The only crib I have is that in the very first sentence I had to look up what BNPL stands for (Buy Now Pay Later).


This is a fantastic article. Insightful and engaging. The only crib I have is that in the very first sentence I had to look up what BNPL stands for (Buy Now Pay Later).